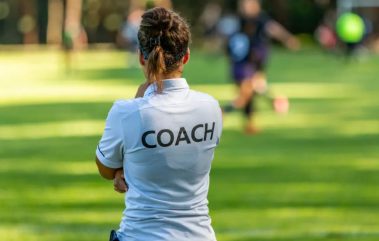
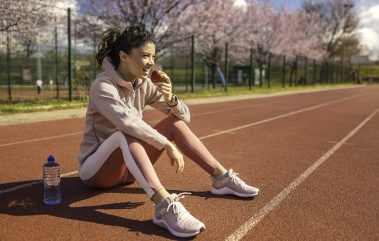
Menstruation has long been subject to uninformed preconceived notions in our society and as a result of the same, has also been largely overlooked with regard to its interplay with the journey of female athletes. While it is quite intuitive to acknowledge that there would be a physical & mental impact of menstrual cycles, it is imperative to also tangibly measure the same thereby empowering athletes as well as coaches to better manage training protocols and overall performance.
In an attempt to understand this phenomenon better, Simply Periods team did a case study with two female athletes. An initial analysis into the above has presented some primary directional trends that are surely worthy of a far deeper exploration
Image Courtesy- Deposit Photos
TL;DR
- Primary analysis was performed on the 80-day data for two selected athletes to assess the potential impact of menstruation on their training performance
- High degree of correlation was found across parameters such as Sleep, Stress, Recovery & Motivation in the case of one athlete while for the other the correlations were not as strong
- The variation in the parameters was found to spike considerably during the menstrual cycle for both the selected athletes
- All in all, it seemed quite evident that while there is a very clear interplay between the physical & mental parameters during menstruation, there also might be a high degree of uniqueness pertaining to each athlete
- While the data collected does offer a great initial starting point into the topic, there were some fundamental gaps in the current design, which if fixed could lead us to conclusive ends for the current hypotheses
- Inadequate sample size & lack of heterogeneity in the data
- Lack of standardisation in the response collection process
- Need for higher degree of subject matter expertise
- A potential skeleton for a Phase II of the exercise has been laid to help us validate the initial findings on a wider scale in a more reliable manner
Learnings from Phase I (please check the link for detailed analysis)
Over the course of 80 days, athletes were asked to provide responses daily on two separate forms tracking certain parameters relating to their training & menstrual cycles.
| Training Tracker | Sleep duration, Resting heart rate, Hydration intake, Urine colour charting, Levels of Recovery/Soreness/Stress/Motivation/Appetite & Rate of perceived exertion |
| Period Tracker | Whether period started, Flow type, Physical symptoms, Whether practice session was missed or curtailed & Other comments |
Based on the regularity of the responses received, the data for two athletes was shortlisted for further analysis into the trends. The pertinent questions that were sought to be explored:
- How do the overall parameters vary across the athletes in general?
- How do these parameters & the deviation therein change during menstruation?
- How do the parameters vary in correlation with each other?
- How do the results differ across athletes for the above trends?
Since the data for only two athletes was sizable & clean enough to dissect, the answers to all of the above would have to be treated as directional rather than conclusive.
Brief summary (detailed analysis in Appendix)
| Some of the parameter averages were drastically different for the two athletes | |
| Sleep duration | Athlete II: 5.4hr vs Athlete VI: 8hr |
| Recovery score | Athlete II: 9.8 vs Athlete VI: 7.7 despite an opposite trend on sleep duration (possibly indicating differing physiological templates) |
| Stress score | Athlete II: 4.5 vs Athlete VI: 7 opposite to the Recovery score trend as expected |
| While the average values remained constant for most parameters during the period of menstruation, the deviation seemed to increase dramatically in most | |
| Athlete II | Only Soreness (52%) & Stress (29%) scores were significantly higher during menstruation, while other parameters averaged nearly the same |
| Both athletes | The Stdev values were significantly higher possibly indicating a higher degree of unpredictability of the parameters |
| The correlation scores between various parameters for the two athletes had very divergent findings again possibly pointing towards variability in response to certain triggers | |
| Athlete II | Reasonably strong correlation was found between three parameters – Sleep, Hydration & Motivation – especially important since the average sleep duration for the athlete was just 5.4hr |
| Stress had a very strong correlation to Flow type, RPE & Soreness | |
| Athlete VI | No positive/negative correlation was found for the athlete in the data except that of Stress & Soreness vs level of Recovery |
Thus, it seems to be quite clear that while many of the performance related parameters are very closely linked to the physical/mental impact of menstruation, it is also evident that there might be a large variability in terms of the unique response of every athlete to the same.
The way ahead – Phase II
A good starting point to think about the possible structure of a Phase II study on the topic would be to enlist the key drawbacks of the current analysis that can be improved:
| Possible improvements | Description |
| Adequate sample size | Involvement of a wider cross section of athletes/coaches ranging across different disciplines, regions & age groups to test the existence of actual correlation as well as individuality |
| Higher heterogeneity | |
| Standardisation in response collection process | Fixed time slot of the day to measure/record parameters |
| Higher degree of quantification especially for responses pertaining to mental factors & menstrual symptoms | |
| Guided definitions for athletes to improve accuracy of the self assessment across all the parameters | |
| Template for physical performance assessment | A fixed set of exercises/activities to be performed by athletes to gauge actual levels of Recovery/Soreness |
| Usage of technology (Fitbit-equivalent) to ensure a common source of truth for physiological data | |
| Expert collaboration | Involvement of subject matter experts to help better formulate the right questions & parameters |
Based on the above, following may be the skeleton helping us design the Phase II exercise:
| Areas of measurement | Physical performance | Mental health | Menstruation input |
| Parameters [to be formalised] |
Revolving around vitals like agility, endurance etc | Revolving around levels of stress, anxiety etc | Degree of symptoms being experienced |
| Mode of measurement | Performance monitoring device (eg. Fitbit) | Standardised Google form with purely MCQ input to be filled during the same time slot each day | |
| SME required | Sports science expert to help define the common physical assessment regimen across disciplines | Sports psychologist to help create a fixed psychometric questionnaire to be filled in by the athletes | Gynaecologist to help quantify the primary physical symptoms |
| Design of the analysis | |||
| Parameters | Heterogeneity | Trends to be identified | |
| TBD | Age | Strong correlations (0.7+) among all combinations | |
| Sports discipline | Variation in the Avg/Stdev across the heterogeneity | ||
| Region | Movement in the Avg/Stdev values over time | ||
| Primary physical attributes (weight, height etc) | Variation in all of the above specifically during the period of menstruation – commonality & individuality | ||
The Phase II exercise as described above surely offers a great opportunity to build an evolving playbook that can guide athletes & coaches alike to better understand the nature of the impact of menstruation on sports performance. With the participation of women being on the rise in the Indian sporting landscape, it is imperative for all stakeholders to be educated about this highly pertinent subject. The involvement of subject matter experts would have a far reaching impact in driving us to the desired codification of training protocol for female athletes across the country.
_________________________________________________________________________
Appendix
- I) Detailed analysis for Phase I
- Average & standard deviation for the measured parameters
| Athlete | Athlete II | Athlete VI | ||
| Overall | Average | Stdev | Average | Stdev |
| SLEEP (in hours) | 5.4 | 0.4 | 8.0 | 0.8 |
| RESTING HEART RATE | 49.9 | 1.2 | 57.5 | 6.3 |
| HYDRATION (in litres) | 3.4 | 0.6 | 3.1 | 0.5 |
| Urine Colour Score | 1.7 | 0.5 | 2.7 | 1.2 |
| RECOVERY | 9.8 | 0.7 | 7.7 | 1.0 |
| SORENESS | 1.2 | 0.6 | 3.2 | 1.5 |
| STRESS_score | 4.5 | 1.1 | 7.0 | 2.4 |
| MOTIVATION_score | 8.0 | 1.4 | 8.3 | 1.9 |
| APETITE_score | 7.1 | 0.6 | 7.4 | 1.7 |
| Rate of Perceived Exertion – RPE | 7.3 | 1.3 | 5.0 | 2.3 |
- Variation in Avg & Stdev during the period of menstruation
| Athlete | Athlete II | Athlete VI | ||
| Delta | Average | Stdev | Average | Stdev |
| SLEEP (in hours) | 0% | 24% | -7% | 15% |
| RESTING HEART RATE | 0% | -8% | 3% | 81% |
| HYDRATION (in litres) | -10% | -9% | 3% | 72% |
| Urine Colour Score | 0% | 0% | 1% | -1% |
| RECOVERY | -6% | 0% | 3% | |
| SORENESS | 52% | 4% | 13% | |
| STRESS_score | 29% | 265% | -3% | -8% |
| MOTIVATION_score | -2% | -3% | -4% | 43% |
| APETITE_score | 5% | 6% | -1% | |
| Rate of Perceived Exertion – RPE | -15% | 292% | 11% | -5% |
- Correlation values between the parameters (only wherever strong/moderate)
| Athlete II | Sleep | Hydration | Recovery | Soreness | Stress | RPE |
| Hydration | 0.66 | – | – | – | – | – |
| Soreness | -0.08 | -0.28 | -0.90 | – | – | – |
| Stress | -0.07 | -0.32 | -0.60 | 0.69 | – | – |
| Motivation | 0.55 | 0.67 | 0.19 | -0.20 | -0.22 | – |
| RPE | 0.02 | 0.26 | 0.80 | -0.75 | -0.79 | – |
| Flow Score | 0.04 | -0.20 | -0.44 | 0.46 | 0.71 | -0.59 |
| Athlete VI | Recovery |
| Soreness | -0.59 |
| Stress | -0.53 |
- II) Selection of athletes for the analysis
| Athlete | Total Days | Expected Responses | Total Responses | Same Day Responses |
| Athlete I | 80 | 160 | 113 | 36 |
| Athlete II | 80 | 160 | 160 | 130 |
| Athlete III | 80 | 160 | 19 | 19 |
| Athlete IV | 80 | 160 | 32 | 22 |
| Athlete V | 80 | 160 | 7 | 7 |
| Athlete VI | 80 | 160 | 120 | 110 |


